I’ve worked as a Data Analyst at Lookers, OFGEM and Meals on Wheels for the last 2 years contributing to its vision and success.
Before working as a Data Analyst, I worked as a Data Entry Engineer and an IT engineer working on digitalising documents, setting up network infrastructures, and writing Powershell scripts.
Check out examples of my success in my dashboards below!
MY SKILLS
App Building – Power Platform
0.5 Year
Retail – Customer Analysis
2+ Year
Marketing – E-commerce
1+ Year
IT Project/Ticketing Analysis
1+ Years
RECENT PROJECTS
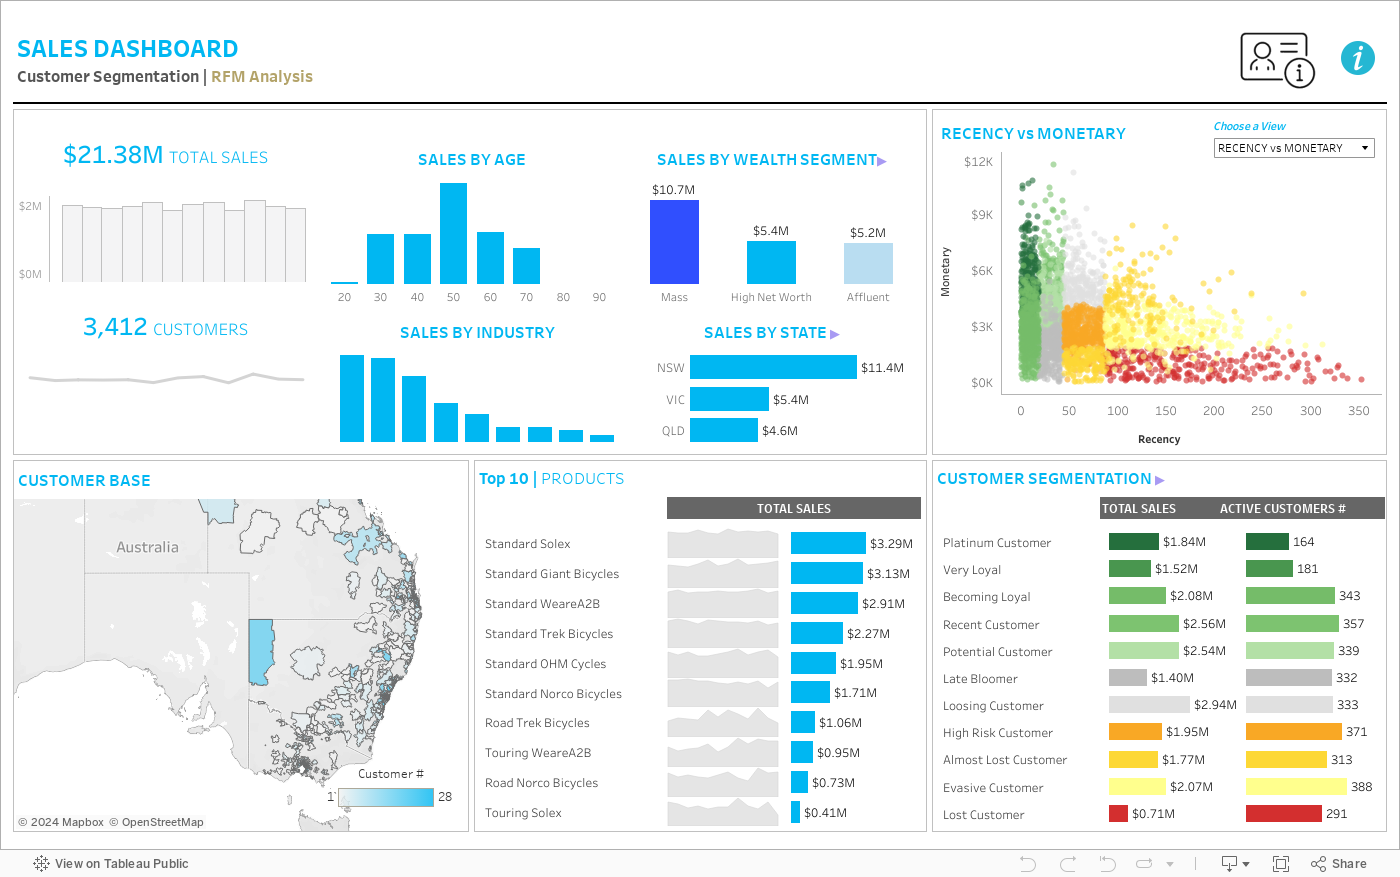
sales dashboard WITH RFM (RECENCY, MONETARY, FREQUENCY) SEGMENTATION
Utilised sales data stored on our SQL server to create a live dashboard used by marketing and product manager
It includes Total Sales by Product and Channel, and ROI for each channel, helping to assess the effectiveness of each marketing channel. It provides a quick overview for upper management to supplement their strategic decision-making
Helping to maximise profits from our top products and best-performing source of customers while boosting low ROI areas
lookers – Sales agent dashboard
Utilised sales data stored on our SQL server to create a live dashboard used by the Sales Manager.
This dashboard includes Total Sales, Average Order Value, Average Daily Sales by Sales Agent, and Week of the Year. It provides a quick overview for upper management to supplement their strategic decision-making.
Additionally, it delves deeper into Brand and Product breakdown helping the product manager to gage which product is the most in-demand, how profitable it is, and which product to prioritise during daily meetings.
meals on wheels – donation Report
Blended data from UA and GA4 into a BigQuery data warehouse where I queried the necessary data using SQL.
The dashboard is centered around geographical expansion projects, allowing stakeholders to filter by town and plan for geographical expansion by comparing surrounding towns for historical interest in their volunteering program.
We decided to track KPIs such as conversion rates, traffic, and bounce rates to align with broader Critical Success Factors of boosting volunteer rates in line with growth in volunteer demands of surrounding schools.
search&rescued – marketing dashboard in excel
Performed analysis of previous Mailchimp campaigns in Excel, helping to identify trends and patterns. I used such tools as PowerQuery, PivotTables, Conditional Formatting, and various formulas.
The historical trend analysis has given the owner of the business the confidence to adjust the mailing schedule to fit with existing conversion patterns, helping to boost our conversion rate by 4% and superseding expected growth by $500.
The implementation of these insights allowed us to exceed the moderate revenue predictions and grow our sales by $700.
CONTACT ME
Feel free to continue browsing, send a message, or connect on LinkedIn!